Facebook
 Twitter
 Pinterest
 Copy Link

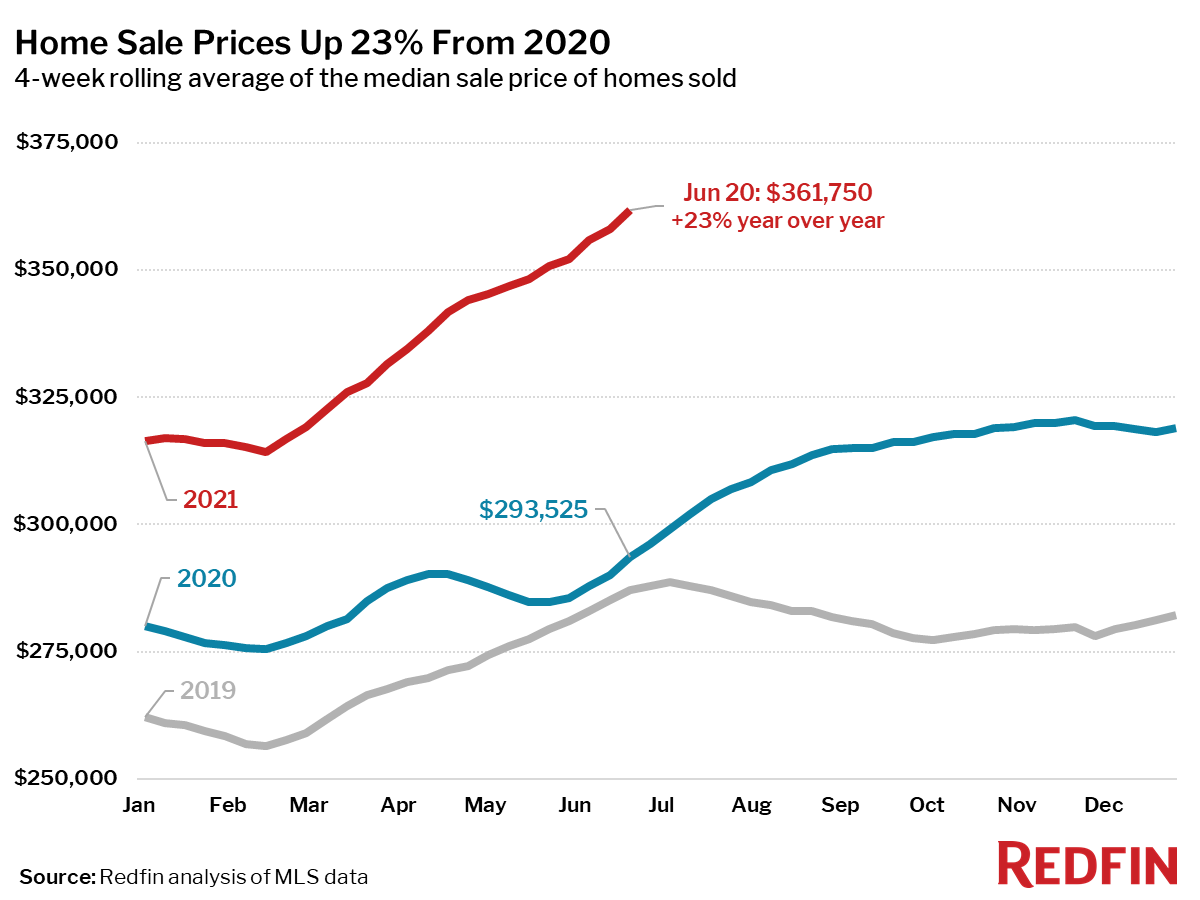
The typical home sold for its highest price on record, at its fastest pace on record, and for 2.3% above list price, the largest sale price premium on record.
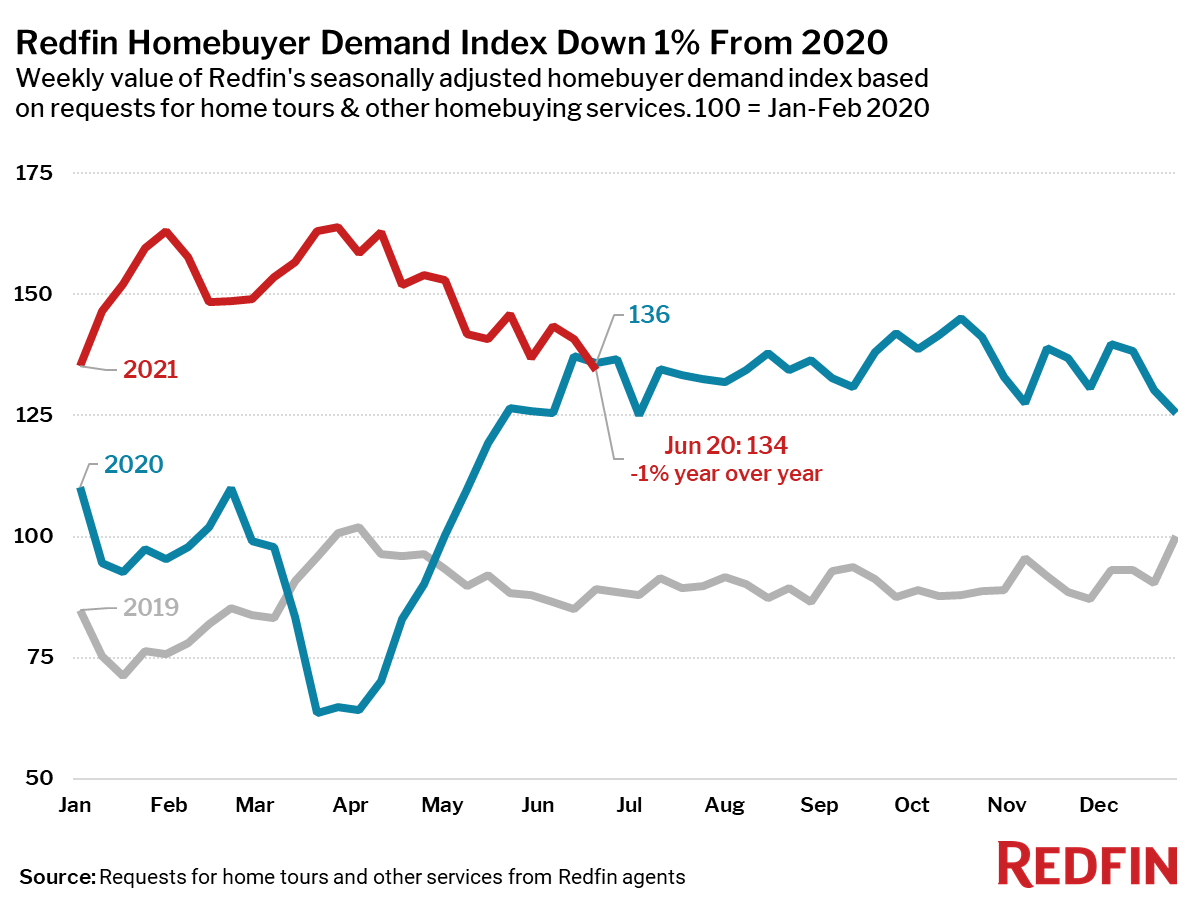
The housing market continues to cool as mortgage rates tick up above 3% for the first time in 10 weeks. The Redfin Homebuyer Demand Index—a measure of requests for home tours and other home-buying services from Redfin agents—has fallen below 2020 levels for the first time this year (-1% year over year for the week ending June 20), and the Mortgage Bankers Association home purchase index has declined 11% since the week ending March 24. As a result of declining sales, the active supply of homes for sale has crept up 5% from the 2021 low in mid-March. However, home prices are still rising, homes are selling in fewer days than ever and more homes than ever are selling above list price. These indicators will take longer to reflect a slowdown since they are based on homes that went under contract a month or two ago.
Unless otherwise noted, the data in this report covers the four-week period ending June 20. Redfin’s housing market data goes back through 2012.
“Some homebuyers are pausing or abandoning their plans to buy because homes in their area have gotten too expensive,” said Redfin Chief Economist Daryl Fairweather. “Even though there are no signs of prices coming down, homebuyers may face a bit less competition and have a bit more selection of homes this summer than they did earlier this year. All year we’ve heard stories about homeowners being reluctant to sell because they don’t want to face such a tough market as a buyer. As the housing market cools slightly, we may see more homeowners finally decide to cash out and move. And as the economy continues to reopen and employers clarify their work-from-home policies, more homeowners may decide that a move is in order.”
Key housing market takeaways for 400+ U.S. metro areas:
Data based on homes listed and/or sold during the period:
- The median home-sale price increased 23% year over year to $361,750, a record high.
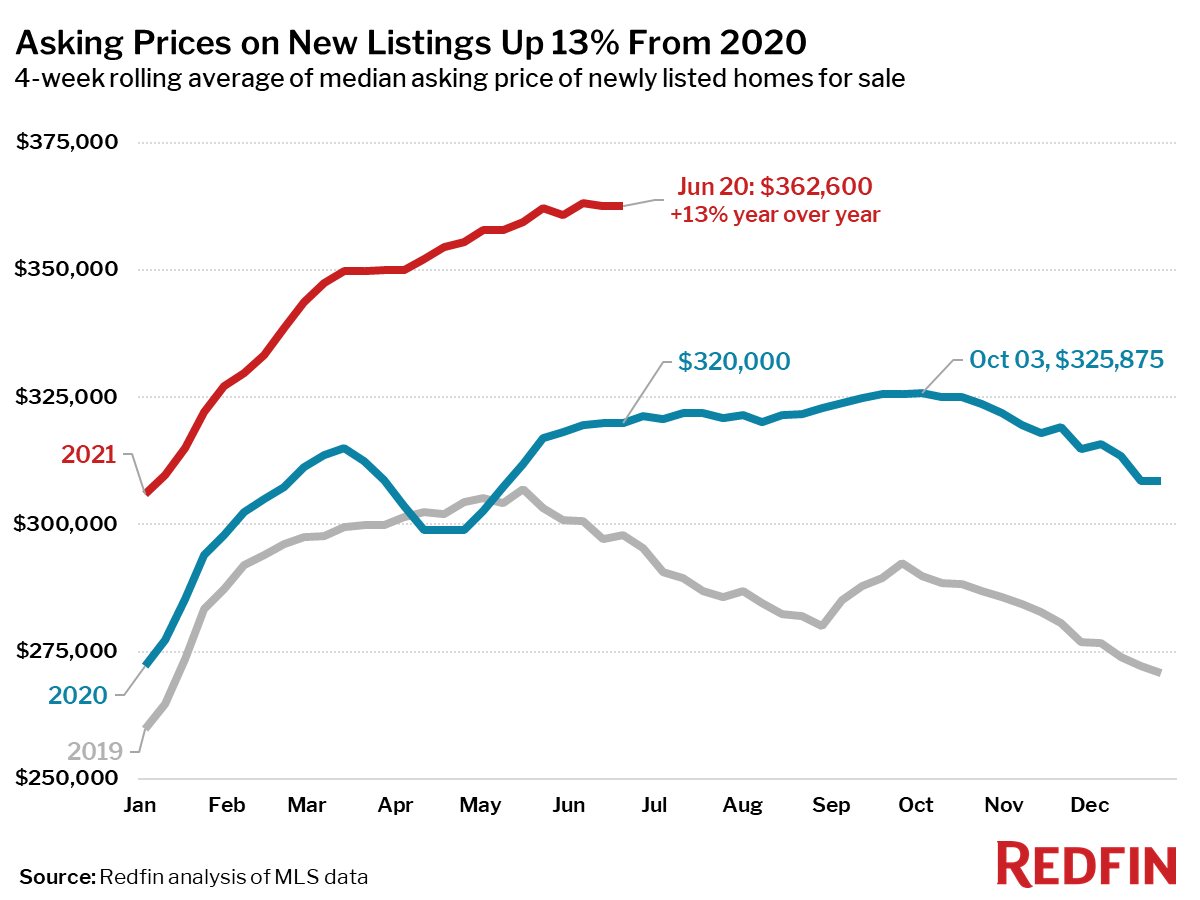
- Asking prices of newly listed homes were up 13% from the same time a year ago to a median of $362,600, down 0.2% from $363,250 during the four-week period ending June 6. From a seasonal perspective, asking prices have held up higher and for longer than they typically do at this point in the late spring.
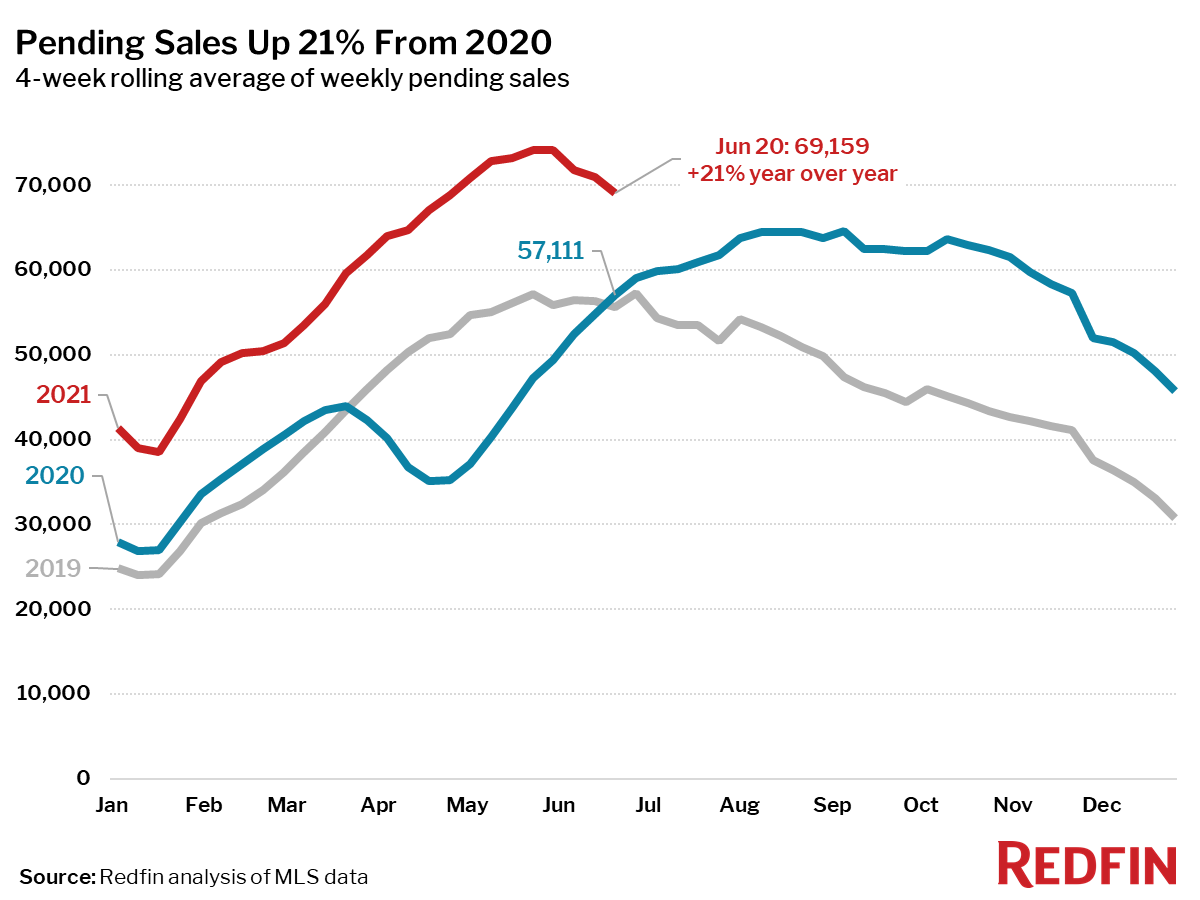
- Pending home sales were up 21% year over year. For the week ending June 20, pending sales were down 10% from the 2021 peak during the week ending May 30.
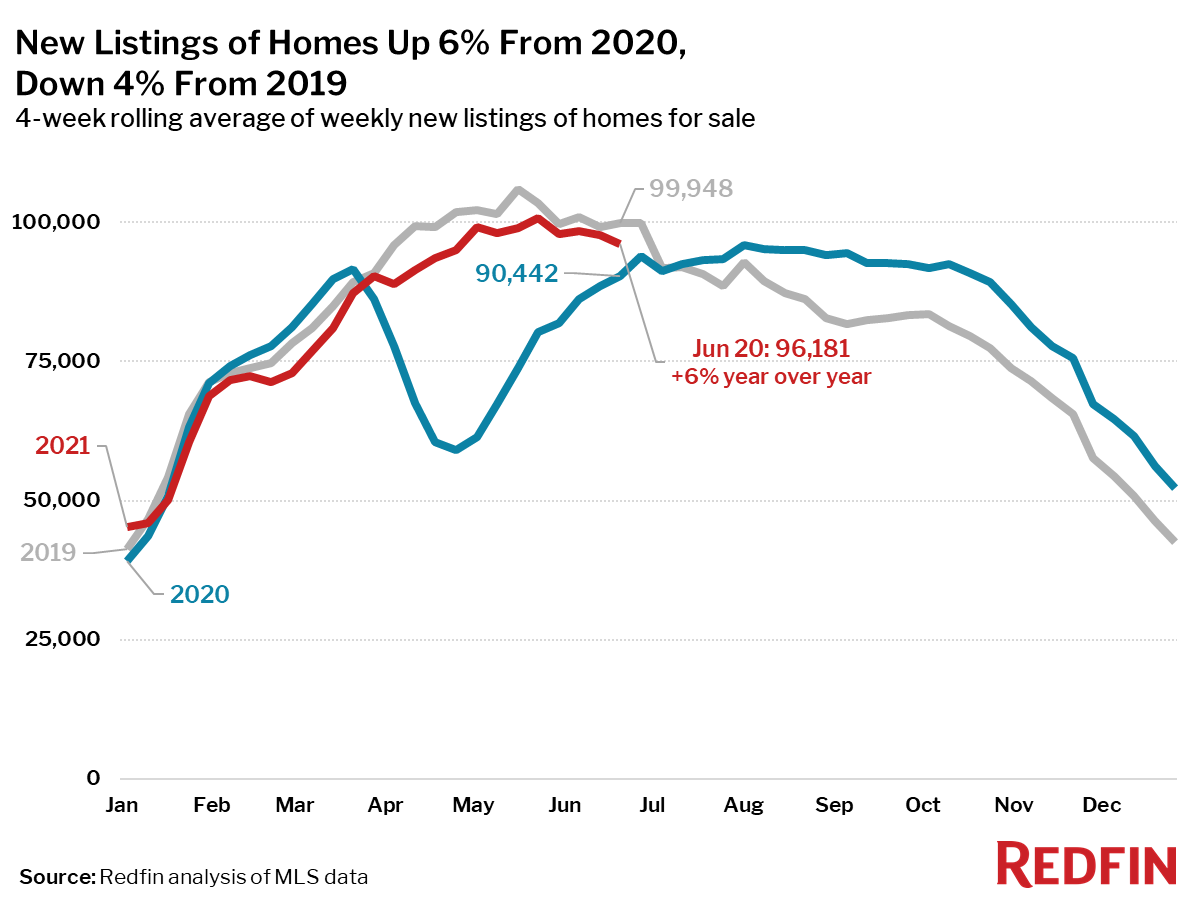
- New listings of homes for sale were up 6% from a year earlier and have declined 5% from the 2021 peak during the four-week period ending May 23.
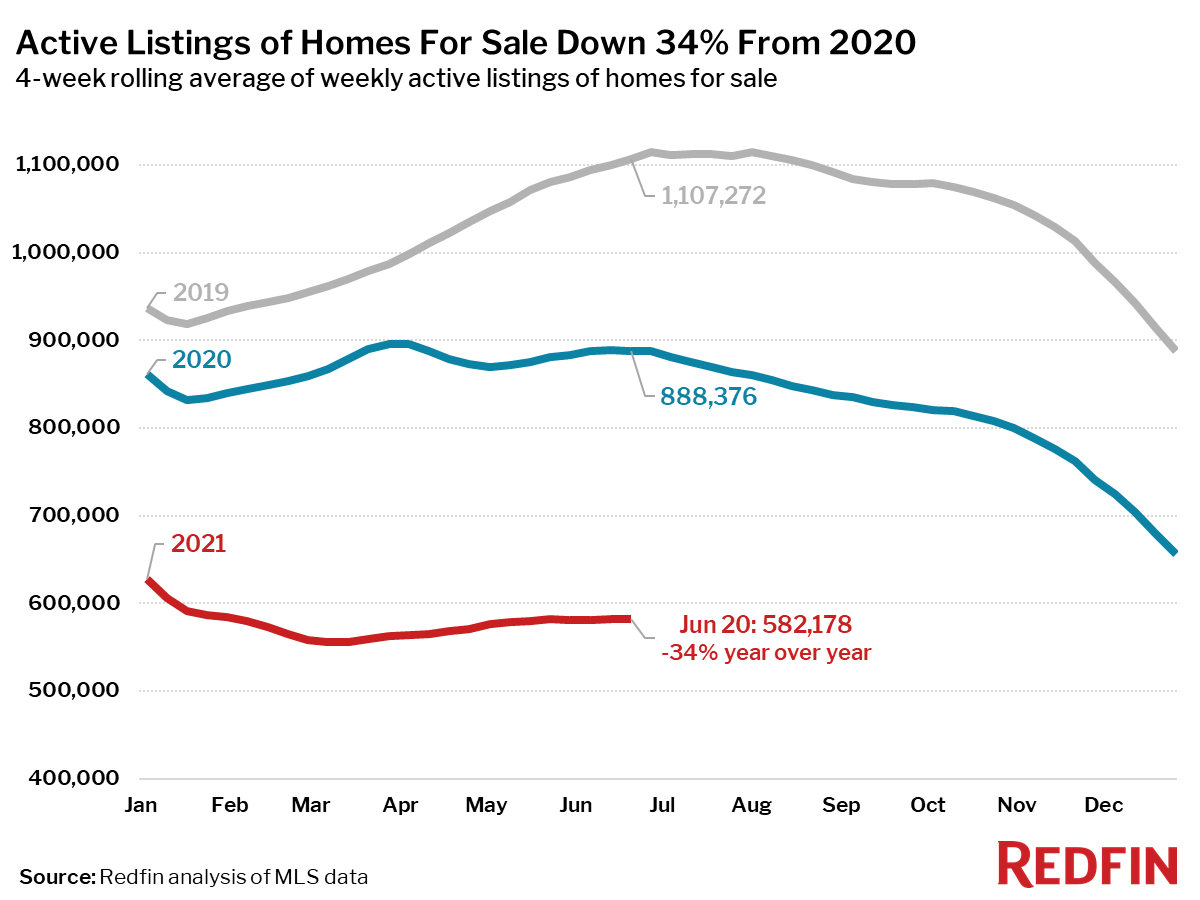
- Active listings (the number of homes listed for sale at any point during the period) fell 34% from 2020, but have climbed 5% since the 2021 low during the four week period ending March 14.
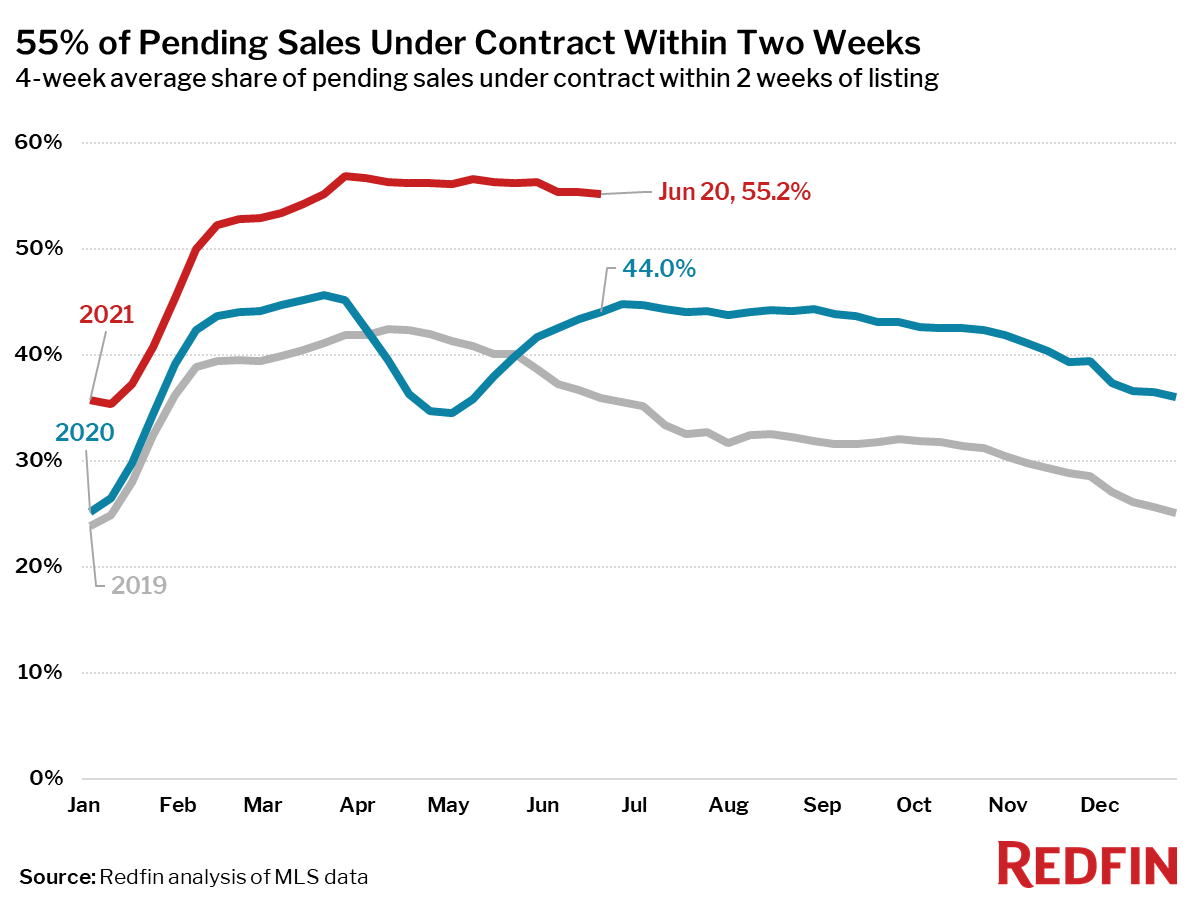
- 55% of homes that went under contract had an accepted offer within the first two weeks on the market, well above the 44% rate during the same period a year ago, but down 1.7 percentage points from the high point of the year, set during the four-week period ending March 28.
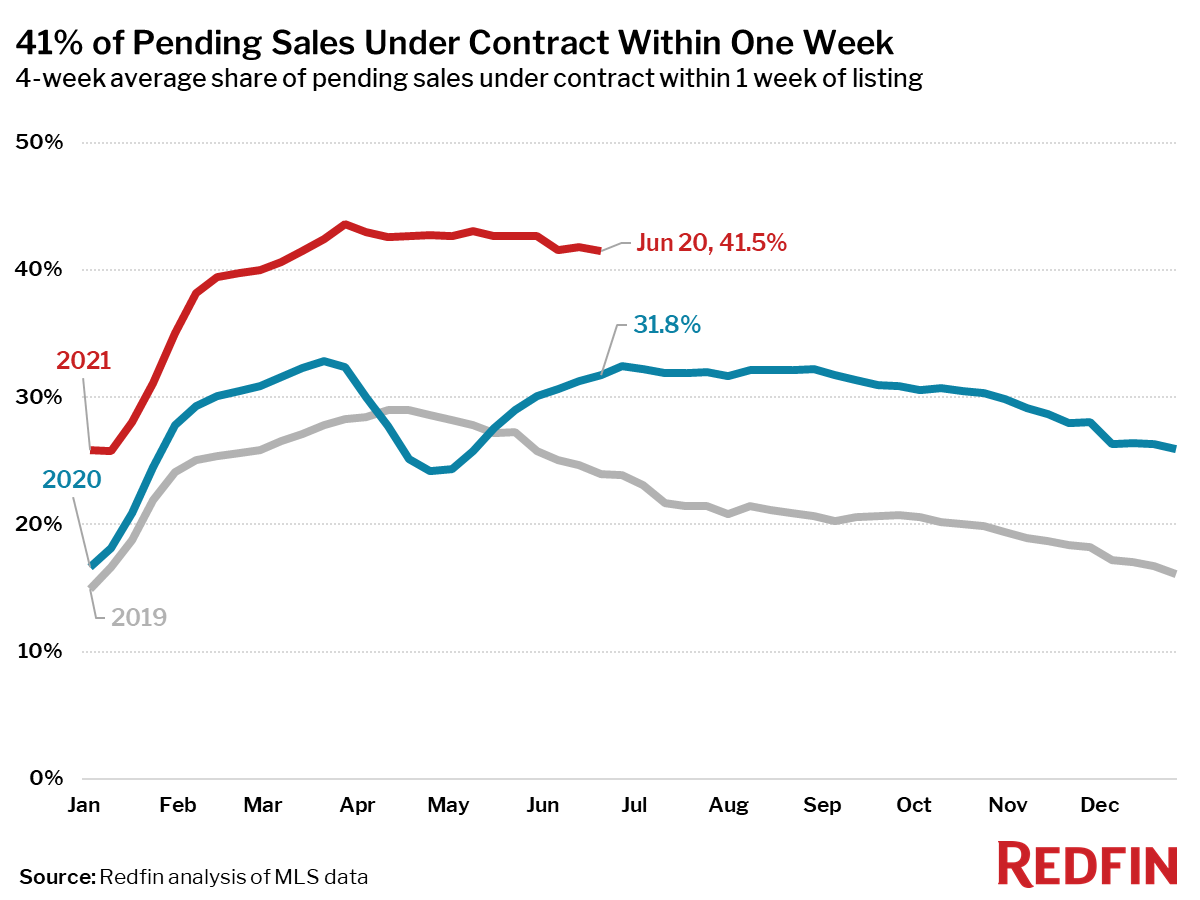
- 41% of homes that went under contract had an accepted offer within one week of hitting the market, up from 32% during the same period a year earlier, but down 2.1 percentage points from the high point of the year, set during the four-week period ending March 28.
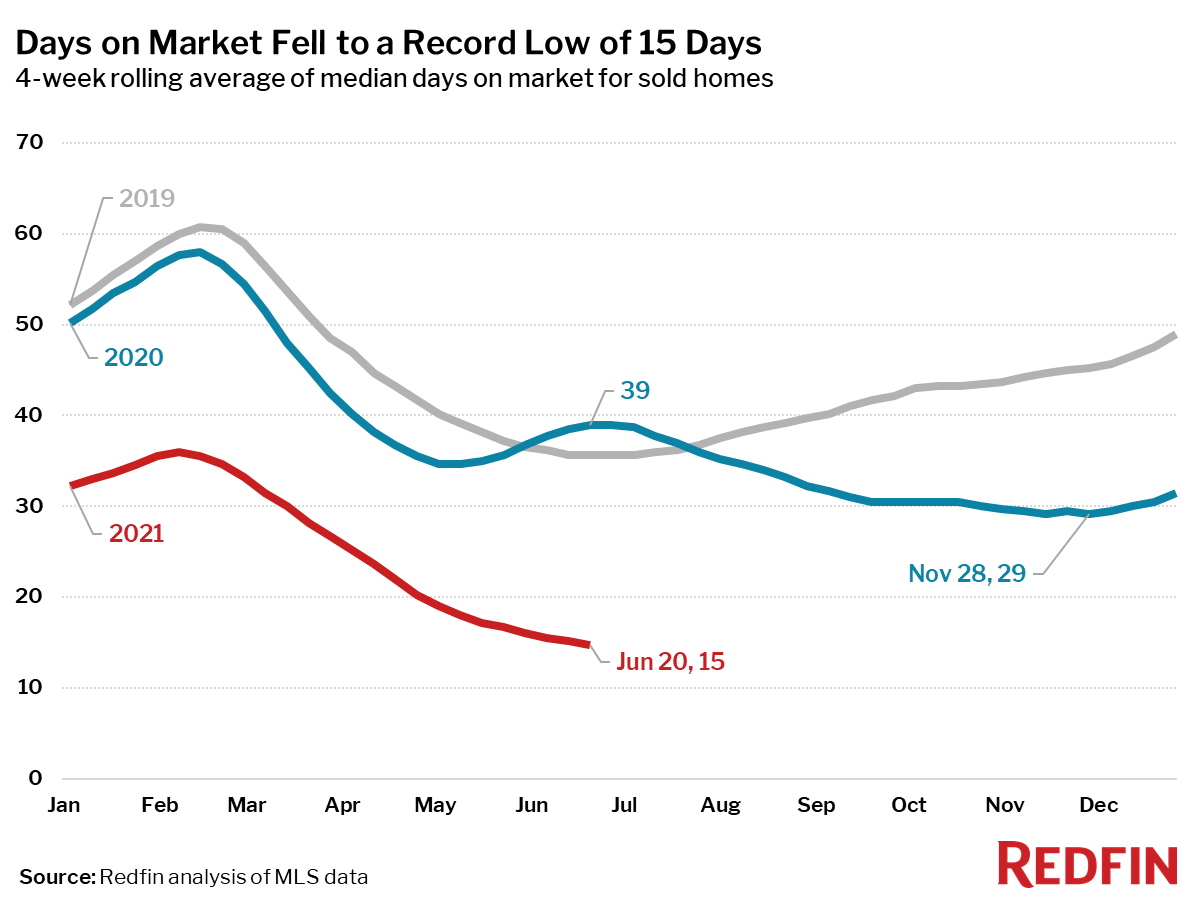
- Homes that sold were on the market for a median of 15 days, a new all-time low and down from 39 days a year earlier.
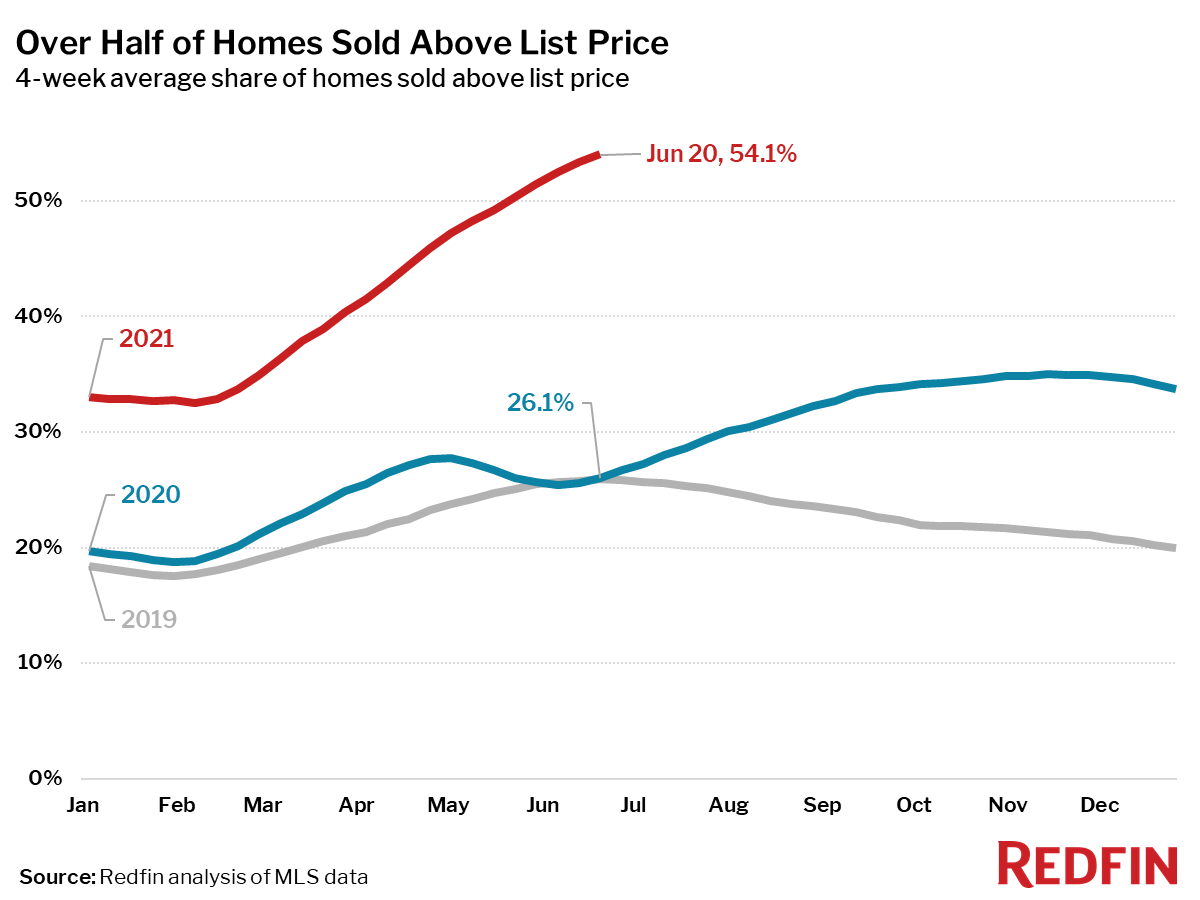
- A record 54% of homes sold above list price, up from 26% a year earlier.
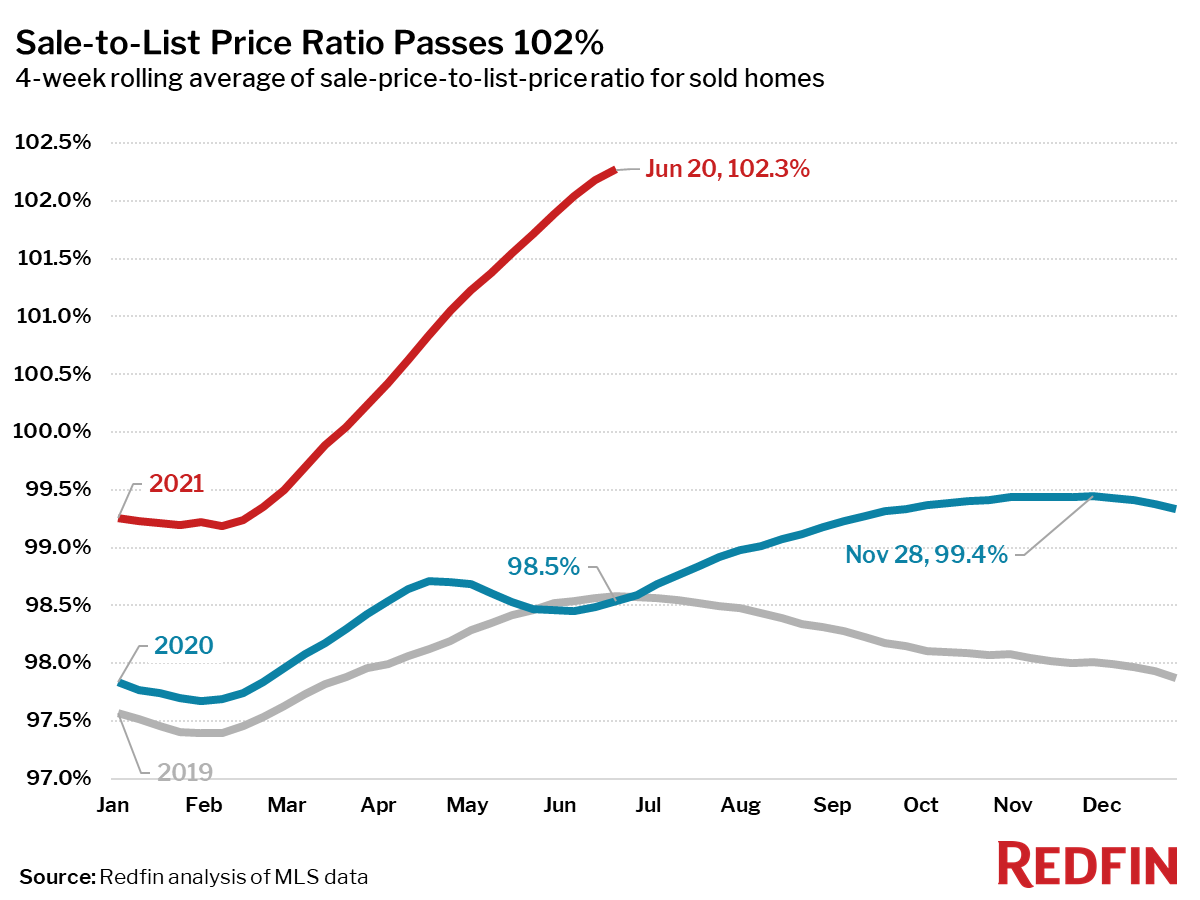
- The average sale-to-list price ratio, which measures how close homes are selling to their asking prices, increased to 102.3%. In other words, the average home sold for 2.3% above its asking price. This measure is 3.8 percentage points higher than a year earlier and an all-time high.
Other other leading indicators of homebuying activity:
- Mortgage purchase applications increased 1% week over week (seasonally adjusted) during the week ending June 18. For the week ending June 24, 30-year mortgage rates rose to 3.02%, the first time rates have been above 3% in ten weeks.
- Home tours as of June 20 were 30% above their level at the beginning of the year, compared to 48% increase at the same point last year according to home tour technology company ShowingTime.
- The seasonally adjusted Redfin Homebuyer Demand Index—a measure of requests for home tours and other services from Redfin agents—fell below 2020 levels for the first time this year during the week ending June 20, and is down 18% from the 2021 high point, which was hit during the week ending March 28.
Refer to our metrics definition page for explanations of all the metrics used in this report.