
 Facebook
 Twitter
 Pinterest
 Copy Link

For many years, investing in California real estate was a no-brainer. Every year an extra half million people needed housing. And they mainly wanted to live in San Francisco or Los Angeles, places that are already full; rents and home prices surged, investors couldn’t miss.
Now the story is different. The population of California increased zero in 2019 and 200,000 people moved away, driven by high housing costs and few new jobs. They moved to Idaho, Colorado, Utah, Arizona, the neighboring lands of opportunity.
There are still 15 million homes in California and a million of them change hands every year, so the real estate market is far from dead. But investors now have to be much more careful about exactly where they put their money and what kind of investment they make.
The pandemic complicates the entire situation. Ultra-low mortgage rates in response to the economic disaster prompted a rush of home sales in 2020, sucking demand from 2021. The financial pain from the lengthening pandemic will bring evictions and foreclosures. Permanent job losses will push more people to move elsewhere. The housing situation won’t be clear until the pandemic is over – and we still don’t know when that will be.
In these circumstances investors are best served by following the numbers, focusing on investments that are favored by local economics, and sticking to the “middle” of the market (more on that below).
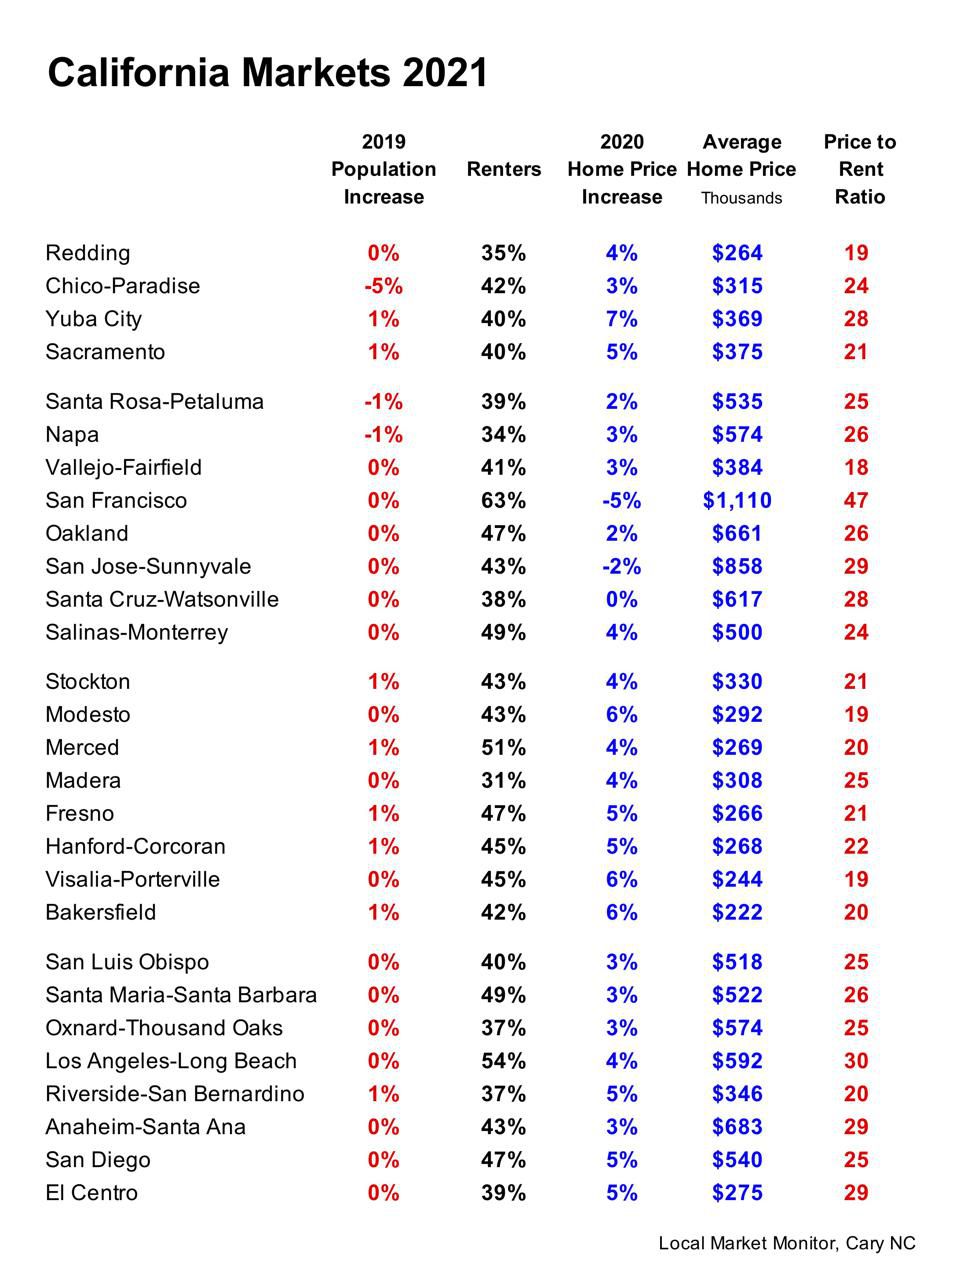
The most striking stat is the first one – the absence of population growth in virtually all these markets. Your investment strategy is fundamentally different when a market is not growing because it’s a zero-sum game; you have to gauge which segment of the existing demand will be strongest. Single-family homes? Apartments? Ownership or rentals? The high or the low end of the market?
Will growth pick up again in a year or so? Can we just ignore this temporary set-back? No. Population growth goes in waves and the wave in California already peaked well before the pandemic
A second key stat is the high percent of renters in most of these markets – the national average is only 35 percent. That correlates with home prices; the higher the average price, the fewer people can afford to buy. But even in the Central Valley, which has the lowest prices in the state, a large proportion of people are renters. That’s because it’s expensive to live in California; compared to their income, Californians pay the highest rents in the country.
The next stat, the increase in home prices in the past year, is a measure of local demand for all housing, not just single-family homes. This past year it was very weak in the expensive Bay Area, much more solid in the Central Valley. Like population, home prices go in long waves, so I expect this trend to continue.
The last stat – the ratio of the average home price to the average annual rent – measures how much the owner and renter segments of the market overlap. It’s a guide to the types of investment that are favored in each market. For example, right now you wouldn’t want to buy a million dollar home in San Francisco, where the ratio is 47, and look for a renter who can afford the high monthly payments – there are some, just not very many. In Visalia-Porterville, by contrast, where the ratio is 19, a straight rental will have a much larger pool of potential renters.
In general, if the price/rent ratio is over 22, apartments or the subdividing of single-family homes into multiple rental units are favored investments. When the ratio is below 16 (right now not the case in our 28 markets, but in some of their submarkets) demand is very weak and straight single-family rentals without expensive improvements are the best bet.
Between 22 and 16, all types of investments can be considered: apartments, subdividing, upgrading properties to higher rents or prices, and flipping (if prices are moving sharply higher).
An important point: the average renter moves within two years. This means that the risk of your investment in a rental property isn’t clear right now; you’ll only know in a year or two, when you need to find new tenants.
My Suggestions.
If you’re looking for real estate markets with the best long-term potential in California, look in the Central Valley. Home prices are still low, land is still cheap and the conversion of more agricultural land to real estate development is inevitable. Even now you can see that it’s one of the few parts of the state that’s growing.
If you’ve already decided on a particular market, remember that this is a difficult time: be cautious, stick to the types of investments suggested by the price/rent ratio, and stick to the middle of the renter market – where you have the least risk of your property sitting empty.
The “middle” of the market is the rent range where you find the largest concentration of existing renters, where you’ll have the easiest time finding replacements when your renters turn over. Census data can help you figure this range out, and – of course – our reports show it for local zip codes.
With lots of renters, California is still a good place for investments in rental property, but these days it pays to be a bit more careful.
By: Ingo Winzer


